
Virtually every company out there is trying to capitalize on the promise of data and analytics — or should be. While leading firms like Amazon and Alibaba seem to have cracked the code, most are still finding their way and many remain unsure where to start. A 2021 study by NewVantage found only 39 per cent of executives believe their organizations manage data as an asset, and even fewer (24%) view their companies as being data-driven. Likewise, in its 2021 survey, Venture-Beat found that just 13 per cent of executives believe their organizations are delivering on their data strategy. These underwhelming findings are consistent with earlier studies by McKinsey, Deloitte and BCG that revealed a large majority of senior leaders are not satisfied with the outcomes delivered through analytics.
What separates leaders from these lagging companies, and how can firms struggling with the analytics mandate catch up with — and even surpass — their competitors? To find out, we surveyed more than 300 senior executives across B2B industries about data-driven decision-making in their organizations and their performance on seven dimensions of analytics capability:
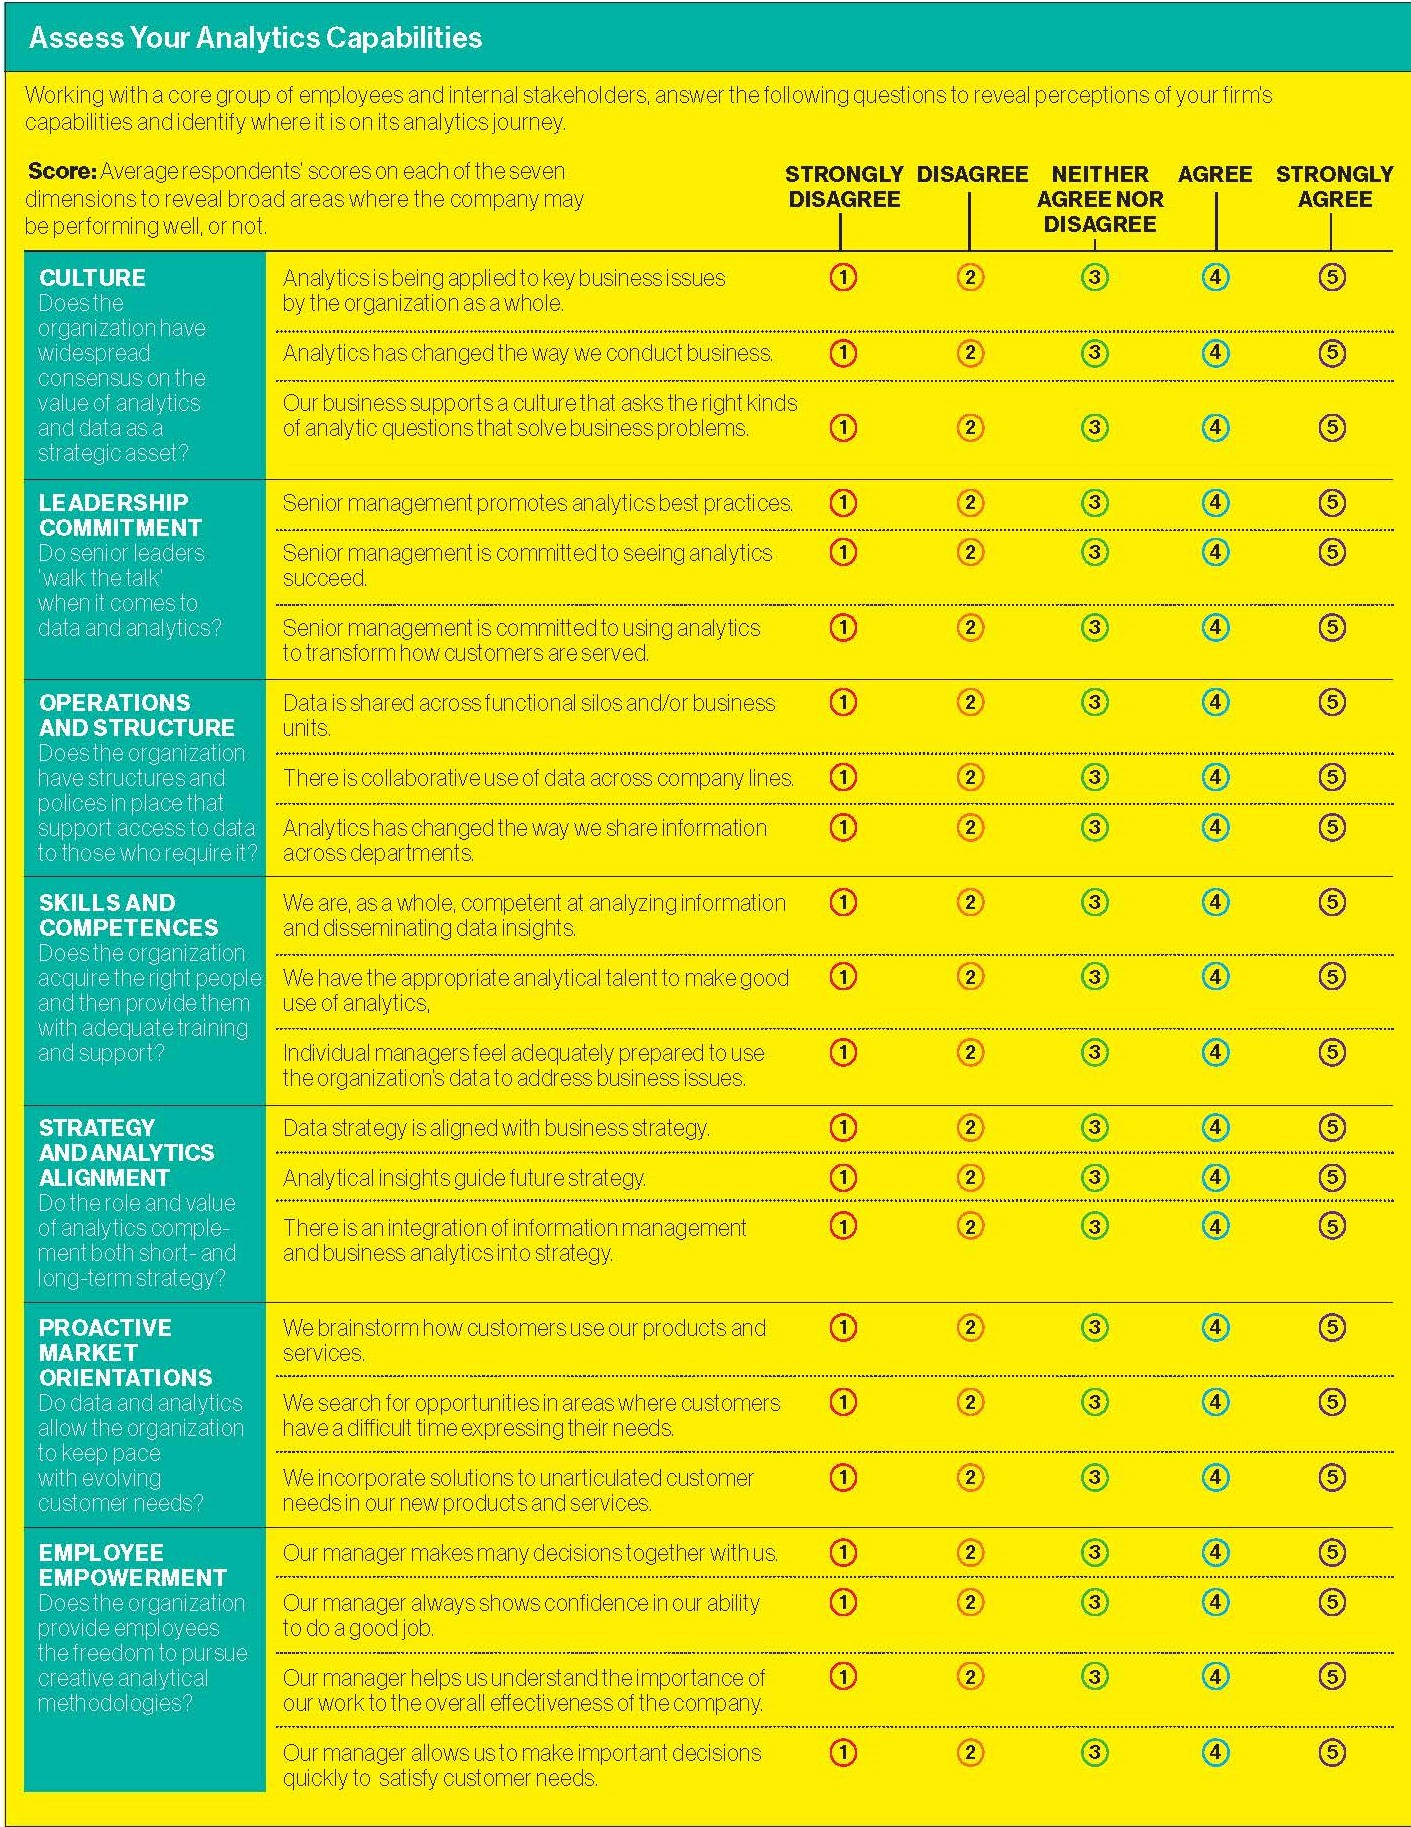
• CULTURE: The degree of consensus on the value of data and analytics as a strategic asset.
• LEADERSHIP COMMITMENT: The extent to which senior leaders ‘walk the talk’ when it comes to data and analytics.
• OPERATIONS AND STRUCTURE: The level of development of structures and policies that support access to data for those who need it.
• SKILLS AND COMPETENCIES: The ability to hire the right people and provide adequate training and support for them.
• ANALYTICS-STRATEGY ALIGNMENT: How effectively analytics complements both short- and long-term strategy.
• PROACTIVE MARKET ORIENTATION: The degree to which data and analytics allow the organization to keep pace with and anticipate evolving customer needs.
• EMPLOYEE EMPOWERMENT: The extent to which people throughout the organization are encouraged to pursue creative data capture and analytical methodologies.
Some companies’ capabilities are well developed
while others remain rudimentary.
Based on our findings, we identified three tiers of companies: data and analytics laggards, strivers and leaders. We then created a tool — see table below [on page 43 in print] — that helps leaders identify where their firm falls on the spectrum and the characteristics and capabilities they may need to develop to further advance on their analytics journey.
The results can reveal a company’s analytics strengths or weaknesses, help it prioritize investments and allocate resources, provide benchmarks for gauging progress and ultimately help it become more data-driven and competitive. They can also help create a common language and mindset which will help create alignment and traction — and reveal differing perceptions of the firm’s capabilities. Further, they can help illuminate the views of those on the front lines or otherwise outside of the leadership circle, whose customer-facing responsibilities will play a vital role in the transformation effort’s progress and success. Following are three steps to taking your organization to the next level.
STEP 1: ASSESS YOUR CAPABILITIES
Not every organization begins its journey from the same place. Some companies’ capabilities are well developed while others remain rudimentary. Regardless, each company needs to answer three questions as it works to enhance its capabilities:
• What is our current level of proficiency?
• In what areas do we need to improve?
• What do we need to do to optimize our data and analytics performance?
To assess your company’s proficiency, assemble a set of core employees and other internal stakeholders representing a range of management levels and business functions. Be sure to engage a diverse sample of staff who will lead and manage teams in the transformation effort (e.g. executives in IT, marketing and HR), as well as front-line employees who will be affected by its implementation, such as those in sales, marketing and customer service. Think of this exercise as a small group workshop with representation that will provide leadership with insights from informed discussion among participants leading to an ‘enterprise wide reality check’ of the company’s current capabilities.
Have each workshop participant individually answer the diagnostic-tool questions in the table below [on page 43 in print] using the one (strongly disagree) to five (strongly agree) scale for each item. Next, aggregate and average respondents’ scores on each of the seven analytics capabilities dimensions (culture, leadership commitment and so on). This will provide a single, overall score on each dimension, revealing broad areas where the company may be performing well, or not.
If the findings reveal areas of notable weakness, leaders may want to focus first on these to create a stable analytics foundation. In other cases, the priority may be to continue building and enhance areas where the tool reveals moderate levels of performance. Conversely, high scores can reveal areas where continued (even modest) investments can help ensure no decline in performance in those areas essential to maintain business success. Top performing companies also can double down on strengths that already confer competitive advantage to put them even further ahead of the analytics strivers and laggards.
While looking at the scores for individual questions can help leaders know where to focus, it can also be valuable to periodically calculate a single, broader company metric by averaging all scores on the seven analytics dimensions. This aggregate measure can allow leadership to track the company’s overall progress over time or compare progress across subsidiaries.
STEP 2: GAUGE EMPLOYEE CONSENSUS
If a company is to move ahead on its analytics journey, it must also strive to build consensus among key players and work out where differences in perceptions of capabilities may exist. As the workshop participants represent different functions, levels of management and lines of business, their individual scores can expose hidden areas of disagreement. If representatives from, say, IT and marketing, or the C-suite and HR have dramatically different perspectives on the firm’s data and analytics capabilities, this is worth investigating and addressing with further informal workshop discussions that focus specifically on areas of disagreement.
Gaining consensus among employees enables an additional benefit: an aligned mindset and use of common language among colleagues. Ultimately, this shared perspective will be socialized across the organization as insights will be disseminated through the ranks. For example, when diverging perspectives emerge in the workshops, understanding why there is disagreement — for instance, one function is aware of capabilities or initiatives that another isn’t — can help leadership design targeted communications that inform and align employee perceptions organization-wide. In other cases, gaps in perceptions among workshop members may accurately reveal fundamental shortcomings that require long-term cultural interventions or the need to immediately hire for critical skills that are lacking.
STEP 3: FIX WEAKNESSES AND ENHANCE STRENGTHS
Firms that complete our diagnostic typically find that they have a mix of strengths and weaknesses. Depending on their industry sector and competitive situation, leaders should focus their attention on those dimensions that are essential to providing superior and sustainable business performance and address key areas where they are performing least well. For lagging companies, this will mean fixing fundamental areas of weakness; for leading companies it will mean optimizing performance on dimensions where they still have room to grow. Drawing on our analysis of leading companies, we have created the playbook below that leadership can use to improve the company’s performance on each dimension.
To enhance culture:
• Integrate data analytics and insights into daily workflows.
• Communicate to the entire workforce how effective use of data is a competitive business advantage, not a byproduct of doing business.
• Help employees become comfortable with making decisions based on data rather than instinct or experience.
• Emphasize the importance and value of ‘data citizenship’ to all employees and stakeholders.
To strengthen leadership commitment:
• Demonstrate that senior leaders take ownership of analytics and are committed to making it central to the company’s success.
• Demystify the topic of data and analytics through ‘use cases’ that are visible and relatable throughout the organization.
• Highlight key investments in analytics technology and human capital.
• Underscore the value of analytics as an asset by linking data-driven decision-making to compensation, rewards, and recognition.
To optimize operations and structure:
• Stress the importance of ‘harmonizing systems use’ across departments and levels when it comes to data and analytics.
• Create performance management incentives to encourage cross-functional collaboration and partnerships in the use of data and analytics.
• Democratize data access across departments without losing sight of privacy, security and compliance considerations.
• Demonstrate how front-line and other non-technical employees can have easier access to data.
To hone skills and competencies:
• Train employees who are in non-analytics roles to embrace data and analytics as a new way of conducting business.
• Help employees in analytics roles to translate technical language into business language.
• Create and nurture career paths that enable non-technical employees to embrace data and leverage its value.
• Recruit talent with proven skills in analytics.
To increase strategy and analytics alignment:
• Demonstrate how the organization’s business strategy is supported by its data strategy (‘best practices use cases’ can be powerful here).
• Ensure that analytics strategy complements, rather than substitutes for, the overall business strategy.
• Use insights and knowledge from analytics to drive and guide the overall business strategy.
• Prevent analytics strategy from overtaking business strategy (i.e. don’t lose sight of analytics as a means to an end).
To increase proactive market orientation:
• Use analytics to predict future customer preferences that may not be obvious now.
• Use analytics to accelerate innovation, even if it means making your own products and services obsolete.
• Use analytics to create breakthrough innovations that offer novel solutions for customers.
• Apply analytics proactively to sense and drive the market.
To enhance employee empowerment:
• Help employees learn about the use and benefits of analytics to achieve business goals.
• Help them feel empowered by showing them how analytics fit it into their daily activities.
• Ensure that employees do not feel trapped (or held hostage) by a constant stream of data.
• Remove bureaucratic obstacles that interfere with data capture or executing an analytics strategy.
In closing
Every company is somewhere along an open-ended journey to achieve data and analytics superiority. While there is no final destination — there will always be more work to do — there is a roadmap for efficiently and strategically progressing on the journey.
By using our diagnostic tool, companies can create a unique profile of their data and analytics capabilities; and, with our playbook, they can then address areas of weaknesses and enhance their strengths, driving an ongoing data and analytics transformation that can deliver real sustained competitive advantage. 
Preethika Sainam is an Assistant Professor of Global Marketing at the Thunderbird School of Global Management, Arizona State University. Seigyoung Auh is Professor of Global Marketing at Thunderbird and Research Faculty at the Center for Services Leadership at the WP Carey School of Business, Arizona State University. Richard Ettenson is Professor and Keickhefer Fellow in Global Marketing and Brand Strategy at Thunderbird. Yeon Sung Jung is Professor of Marketing at Dankook University in South Korea. This article originally appeared at HBR.org.
4 Data Analytics Concepts Every Leader Should Understand
|
|
Data analytics is ultimately about making good decisions. It doesn’t matter what business you are in or what your role is at your company, we all want to — need to, really — make smart, informed, evidence-based decisions. Following are four concepts every leader should understand:
RANDOMIZED CONTROLLED EXPERIMENTS. One of the first steps in any analysis is data gathering. This often happens via a spectrum of experiments that companies do — from quick, informal surveys, to pilot studies, field experiments and lab research. One of the more structured types is the randomized controlled experiment. Many people, when they hear this term, immediately think of costly clinical trials. But randomized controlled experiments don’t have to be costly or time consuming.
They can be used to gather data on things like whether a particular customer service intervention improved customer retention or whether a new, more expensive piece of equipment is more effective than a less costly one.
A/B TESTING. One of the more common experiments companies use these days is the A/B test (which is a type of randomized controlled experiment). At their most basic, these tests are a way to compare two versions of something to figure out which performs better. Companies use it to answer questions like, ‘What is most likely to make people click? Or buy our product? Or register with our site?’ A/B testing is used to evaluate everything from website design to online offers to headlines to product descriptions. It’s critical to understand how to interpret the results and to avoid common mistakes, like ending the experiment too soon before you have valid results or trying to look at a dashboard of metrics when you really should be focusing on a few.
REGRESSION ANALYSIS. Once you have the data, regression analysis helps you make sense of it. Of course, there are many ways to analyze the data, but linear regression is one of the most important. It’s a way of mathematically sorting out whether there’s a relationship between two or more variables.
For example, if you are in the business of selling umbrellas, you might want to know how many more items you sell on rainy days. Regression analysis can help you determine whether and how rain impacts sales. It answers the questions: Which factors matter most? Which can we ignore? How do those factors interact with each other? And, perhaps most importantly, how certain are we about all of these factors?
Fortunately, regression is not something you typically do on your own. There are statistics programs for that! But it’s still important to understand the math behind it and the types of mistakes to avoid. In this refresher, I explain how regression works and share a common — but often misunderstood — warning against confusing correlation with causation.
STATISTICAL SIGNIFICANCE. Once you’ve done the analysis, you need to figure out what your results mean, if anything. This is where statistical significance comes in. This is a concept that is also often misunderstood and misused. And yet because more and more companies are relying on data to make critical business decisions, it’s an essential concept to understand. Statistical significance helps you quantify whether a result from an experiment is likely due to chance or from the factors you were measuring.
|
Share this article: